Out of Reach Press Contact and Kit
Please complete the information below to receive press updates on NLIHC's Out of Reach.
The presskit (English|Spanish) contains images from Out of Reach that can be used online or in print. Permission to reprint all or some of the images is granted, provided appropriate credit is given to the National Low Income Housing Coalition (NLIHC). All images are copyright of NLIHC.
For questions regarding media coverage and reprints, please contact Jen Butler, Vice President of External Affairs, [email protected], 202-662-1530 x239.
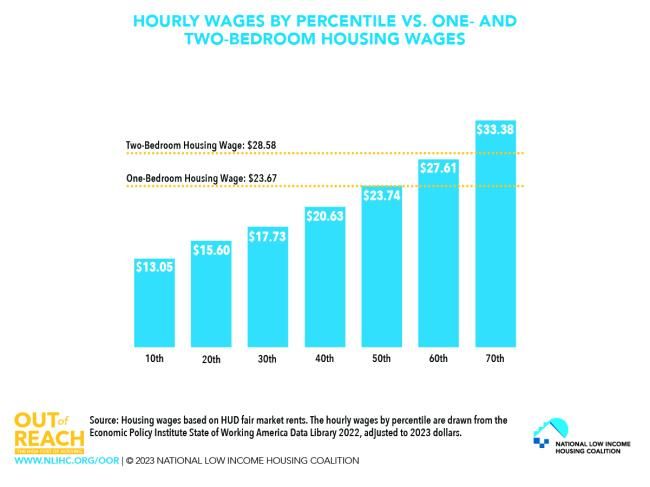
HOURLY WAGES BY PERCENTILE VS. ONE- AND TWO-BEDROOM HOUSING WAGES
Chart shows hourly wages of workers by percentile compared to the Housing Wages needed to afford a one- and two-bedroom apartment. More than sixty percent of all workers earn an hourly wage that is less than the two-bedroom Housing Wage, and nearly 50% of workers earn an hourly wage that is less than the one-bedroom Housing Wage.
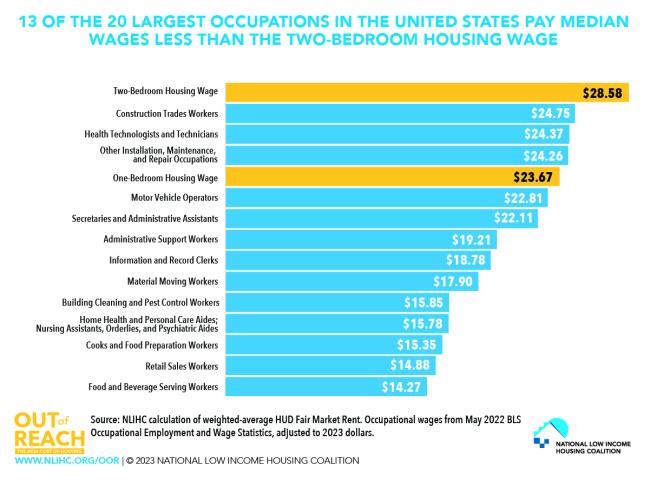
THIRTEEN OF THE TWENTY LARGEST OCCUPATIONS IN THE UNITED STATES PAY LESS THAN THE HOUSING WAGE
Chart compares the median hourly wages of the county’s most common low-wage occupations with the national one- and two-bedroom housing wage. Thirteen of the 20 most common occupations pay median wages that are lower than the two-bedroom Housing Wage, and 10 of these occupations pay median wages that are lower than the national one-bedroom Housing Wage.
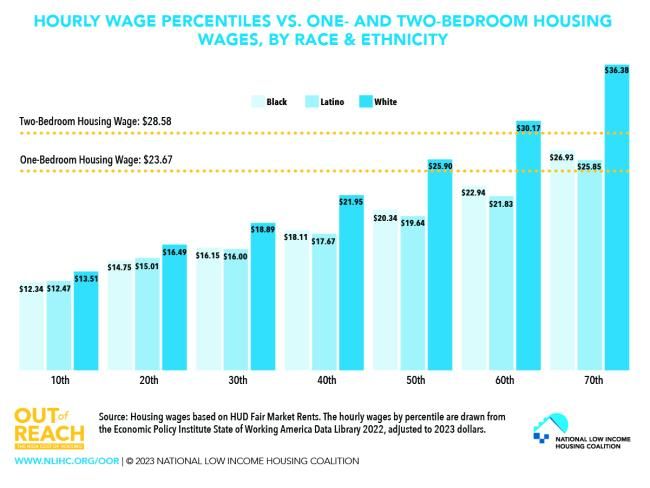
HOURLY WAGE PERCENTILES VS. ONE- AND TWO-BEDROOM HOUSING WAGES, BY RACE & ETHNICITY
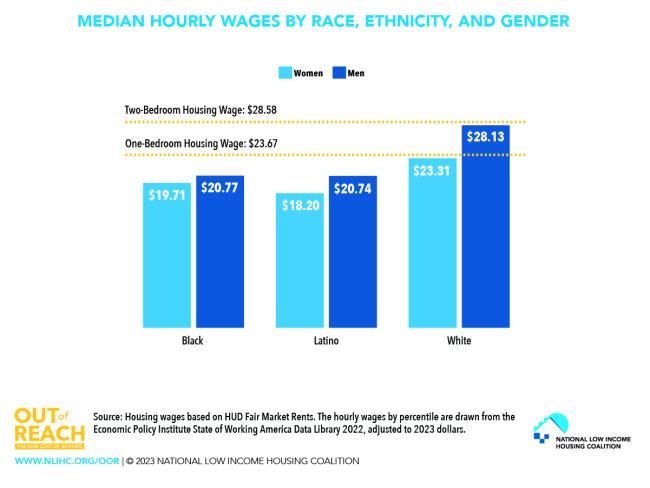
Chart shows wages earned by percentile for white, Black, and Latino workers compared to the one- and two-bedroom housing wage. The median Black and Latino worker earn approximately $5.56 and $6.26 less per hour, respectively, compared to the median white worker.
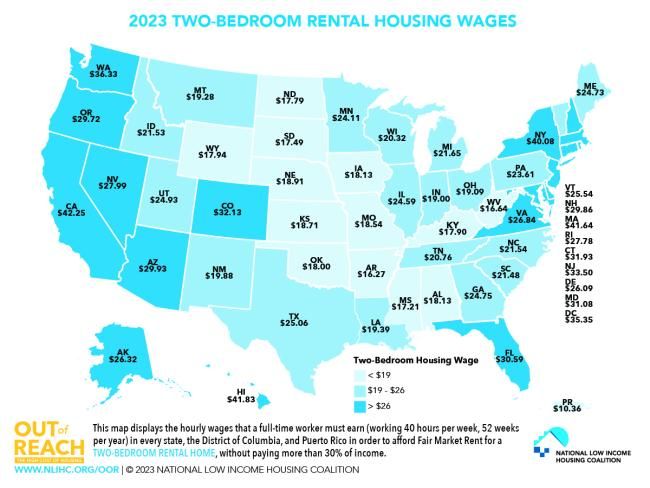
2023 TWO-BEDROOM RENTAL HOUSING WAGES
In nearly every state, a renter working full-time and earning less than $16 per hour is unable to afford a two-bedroom apartment. Housing wages are highest in traditionally high-cost states, like California, Hawaii, Massachusetts, and New York, but areas with lower housing wages tend to have lower wages, so tenants in these areas still struggle to afford housing.
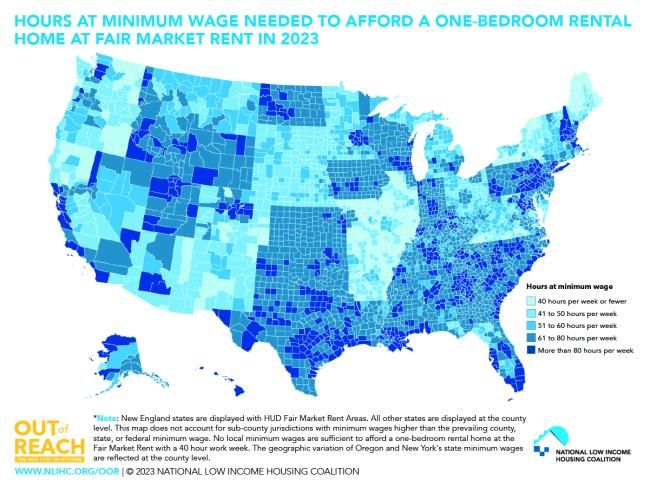
HOURS AT MINIMUM WAGE NEEDED TO AFFORD A ONE-BEDROOM RENTAL HOME AT FAIR MARKET RENT IN 2023
Map shows the number of hours a minimum wage worker must work to afford a one-bedroom rental at Fair Market Rent, with darker areas representing more hours. In only 7% of counties (228) nationwide, not including Puerto Rico, can a full-time minimum-wage worker afford a one-bedroom rental home at fair market rent by working only 40 hours per week.

